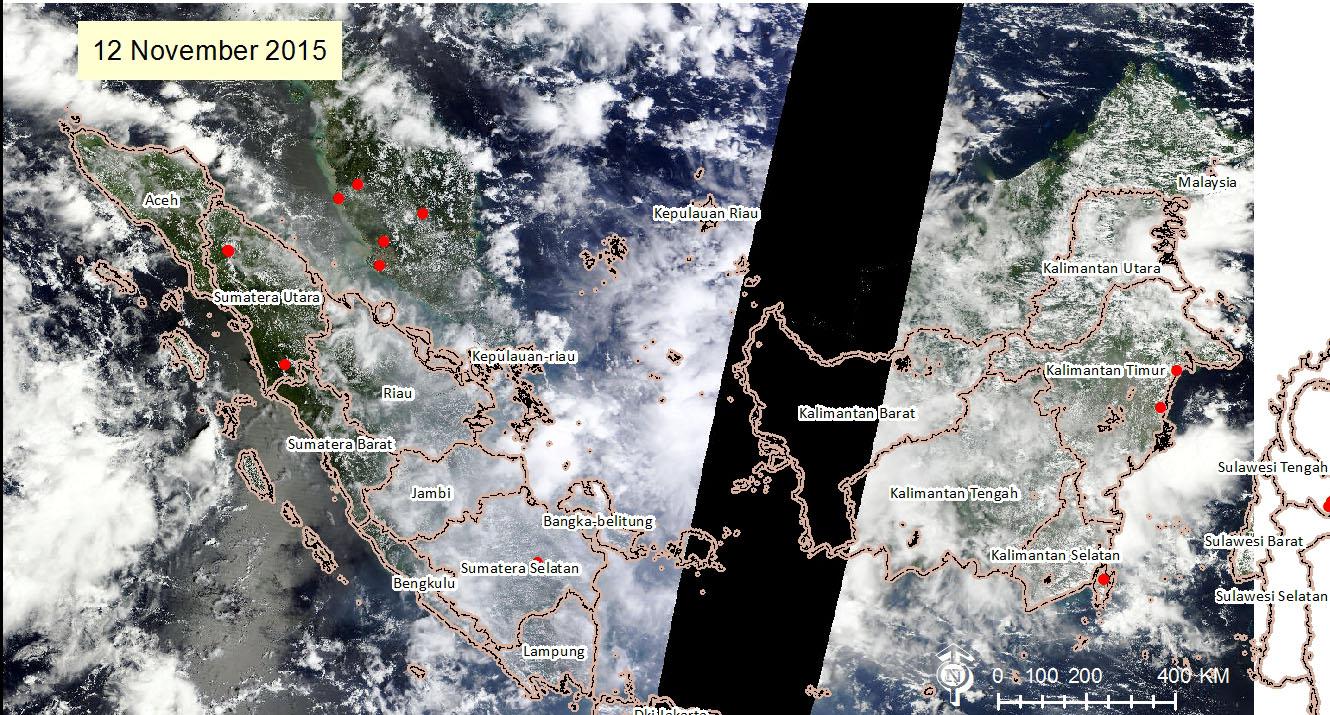
Haze and Hotspots Maps 16 November 2015
On 16th November, the number of hotspots detected in South Sumatera has increased from 9 hotspots the previous day to now 35 hotspots. While there were no hotspot detected in East Kalimantan due to the imagery void over the province.
The CO2 pollution over Palembang and the surrounding area measured around 0.23 ppmv and 0.20 ppmv over the southern part of East Kalimantan.
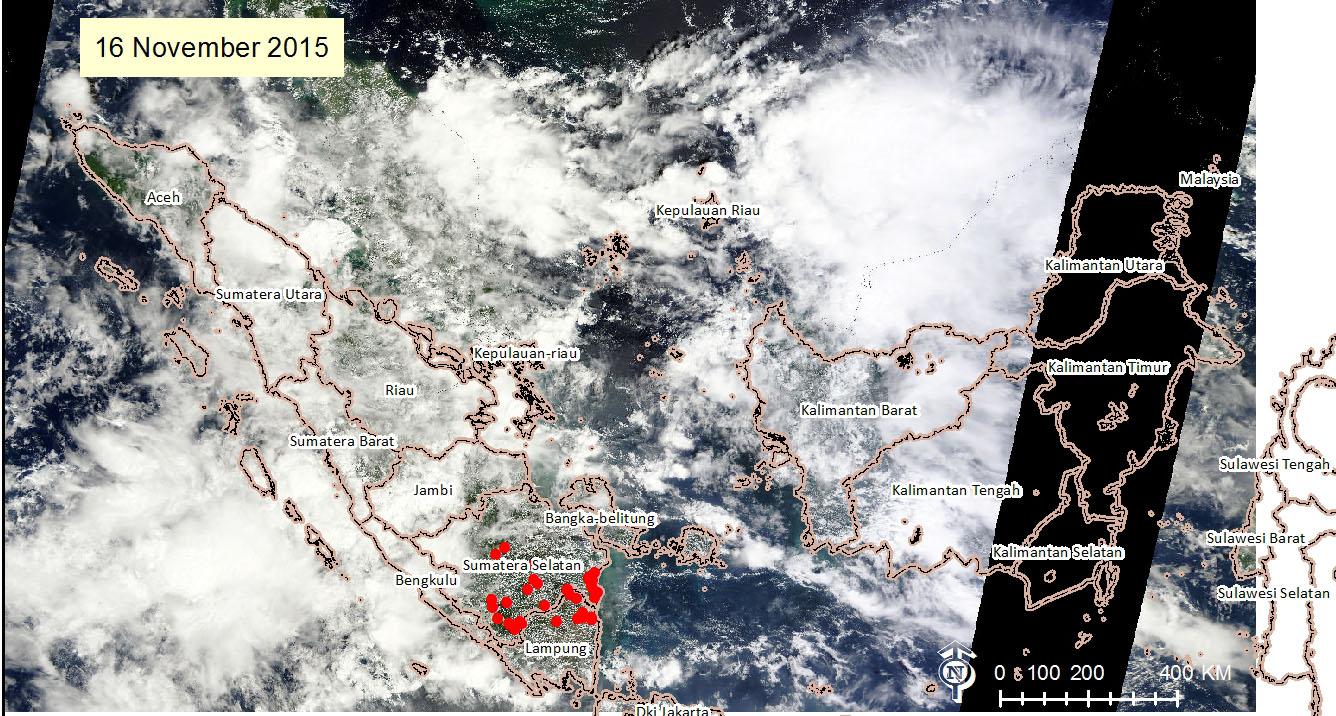
Haze and Hotspots Maps 15 November 2015
On 15 November 2015 there were 71 hotspots detected in East Kalimantan, while there were no hotspot detected in the province the day before. In South Sumatra there were 9 hotspots detected , which shows a significant decrease from yesterdays numbers (64).
Haze and Hotspots Maps 13 November 2015
There were 10 hotspots detected in South Sumatera, increasing from the previous day (1), while there are 2 hotspots detected in Kalimantan Timur (East Kalimantan)

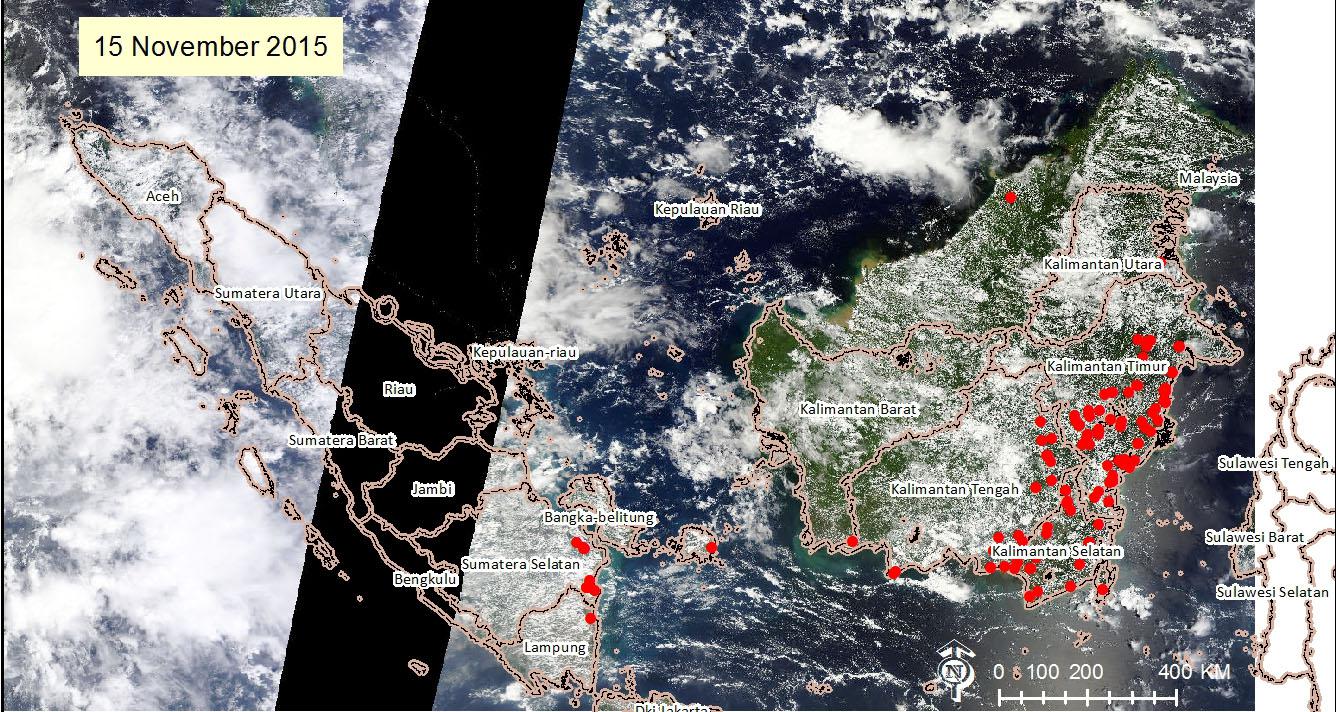
Haze and Hotspots Maps 14 November 2015
There was a significant increase of the number of hotspots detected in South Sumatera province: while on 13th November there were 10 hotspots detected, on the 14th November there were 64 hotspots detected. However, there was no hotspot detected in East Kalimantan.
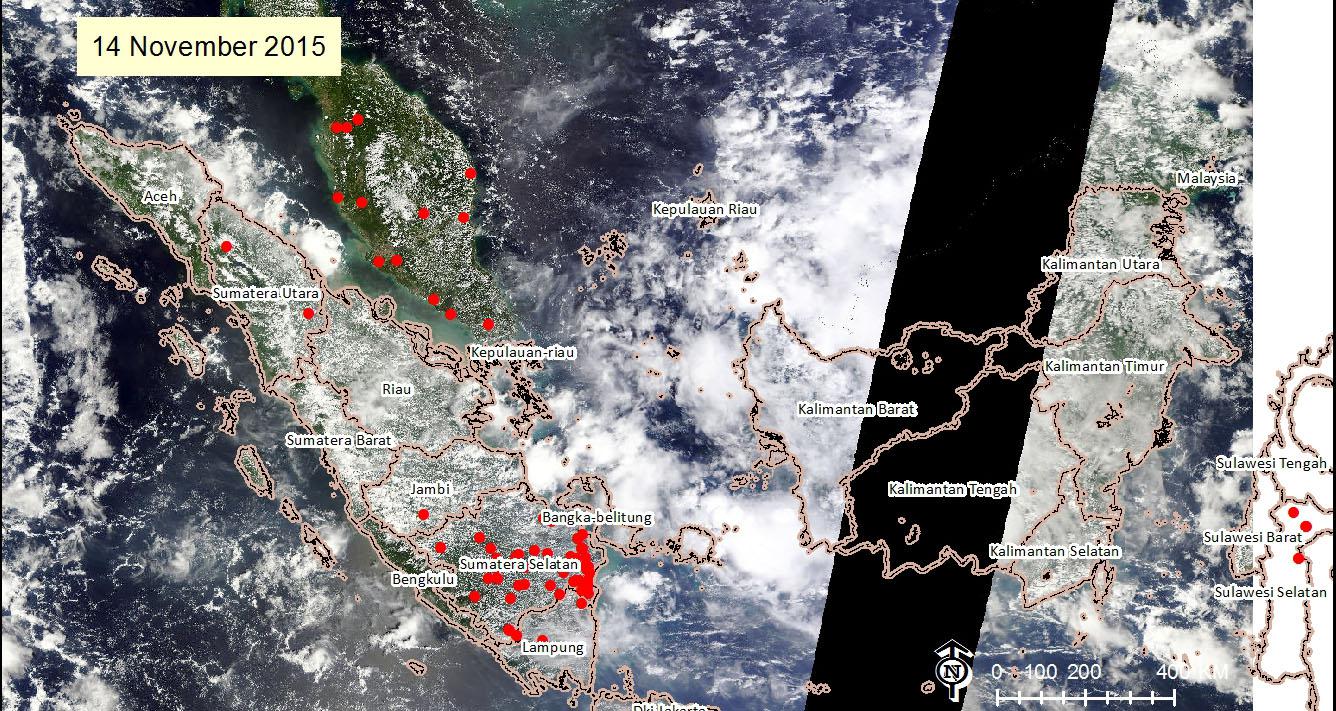
Haze and Hotspots Maps 12 November 2015
On 12th November, there was only 1 hotspot detected in South Sumatera and 2 hotspots detected in East Kalimantan. The decreased number of hotspots in Sumatera Selatan might have occured due to high cloud cover over the province.
