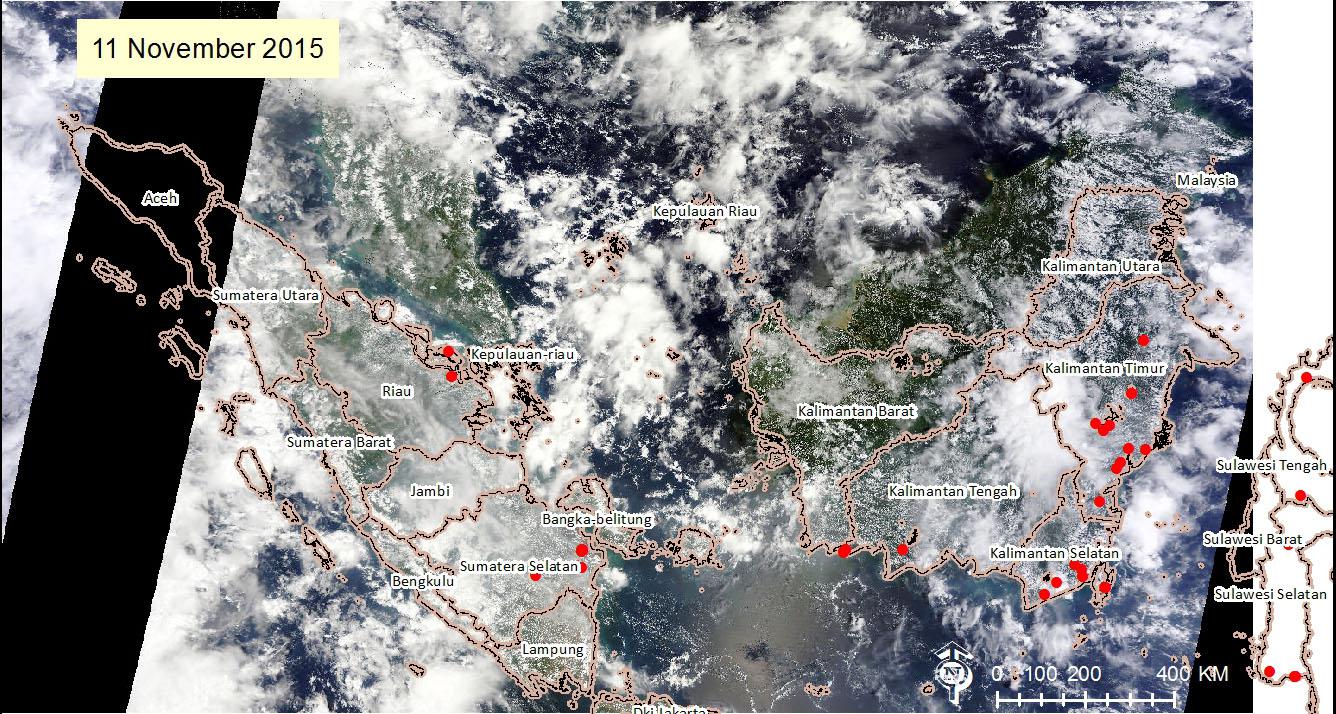
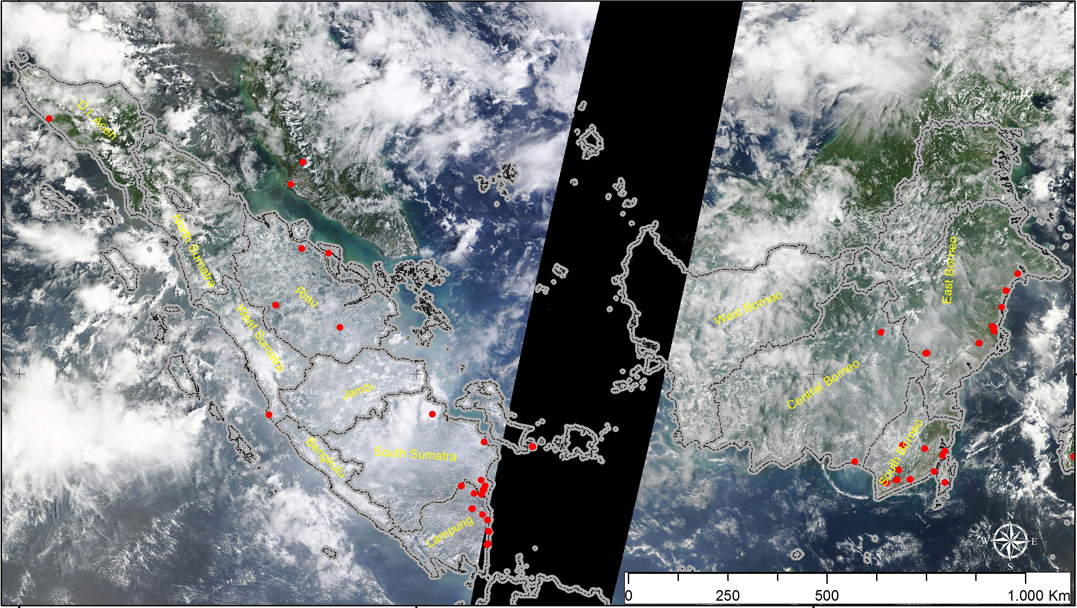
Haze and Hotspots Maps 11 November 2015
On 11th November 2015, the number of hotspots slightly increased since the day before; there were 10 hotspots detected in South Sumatera (due to weak satellite coverage on 9th November, which did not cover all of South Sumatera province). For East Kalimantan there were 12 hotspots detected, which is a slight increase from yesterday’s numbers (9).
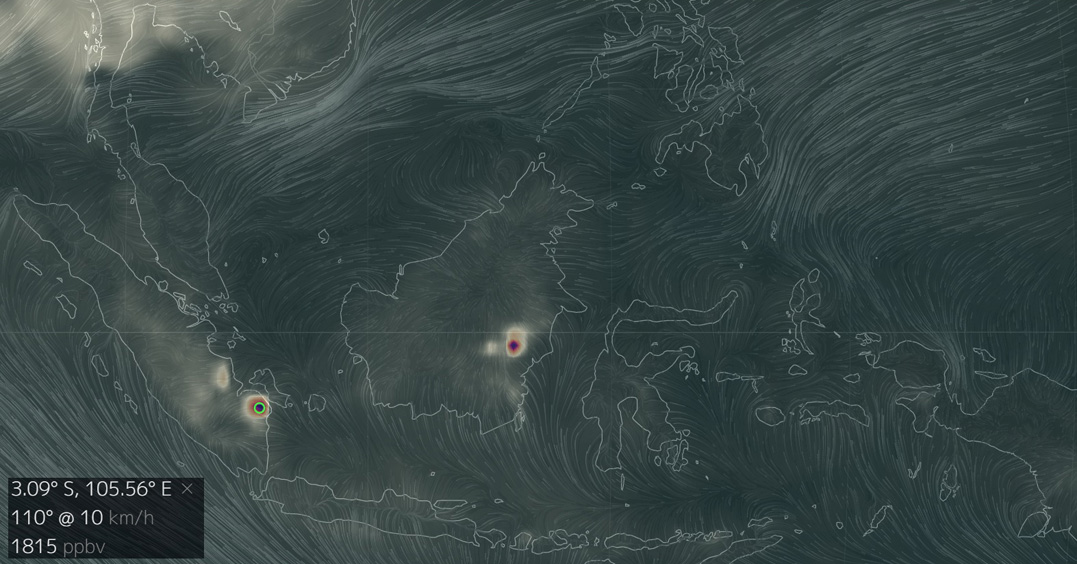
Haze and Hotspots Maps 10 November 2015
November 10th 2015
There are 6 hotspots detected in South Sumatera, far less then yesterday, where there were 61 hotspots detected. However, this low number could be due to the satellite not covering all of South Sumatera.
For today, there are 9 hotpots detected over East Kalimantan, while yesterday there was only one hotspot detected. This might be due unsufficient satellite coverage.
The CO pollution continues to decrease. Today it is estimated 0.34 over Palembang and surrounding area while yesterday it was approx. 0.50.
And for Samarinda and surrounding area, the CO2 pollution also has been decreasing, from 0.14 ppmv yesterday to 0.15 today.

Haze and Hotspots Maps 3 Nov 2015
Modis imagery of November 3rd: still some hotspots detected in East Kalimantan as well as in the district of East Kutai and some in Kutai Kartanegara. Some rain in parts of East Kalimantan (Samarinda and Balikpapan) Today’s wind and carbon monoxide concentration shows a decreasing air pollutant concentration compared to November 2nd . East Kalimantan: from 1.84 to 0.64 ppmv and South Sumatera from 9.35 ppmv to 2.04 ppmv (parts per million volume, unit for air pollutant)
Source: https://earthdata.nasa.gov/labs/worldview/?p=geographic&l=MODIS_Terra_CorrectedReflectance_TrueColor,Coastlines,MODIS_Fires_All&t=2015-10-30&v=101.39907619219355,-6.1586696842422235,123.89907619219355,4.7749240657577765
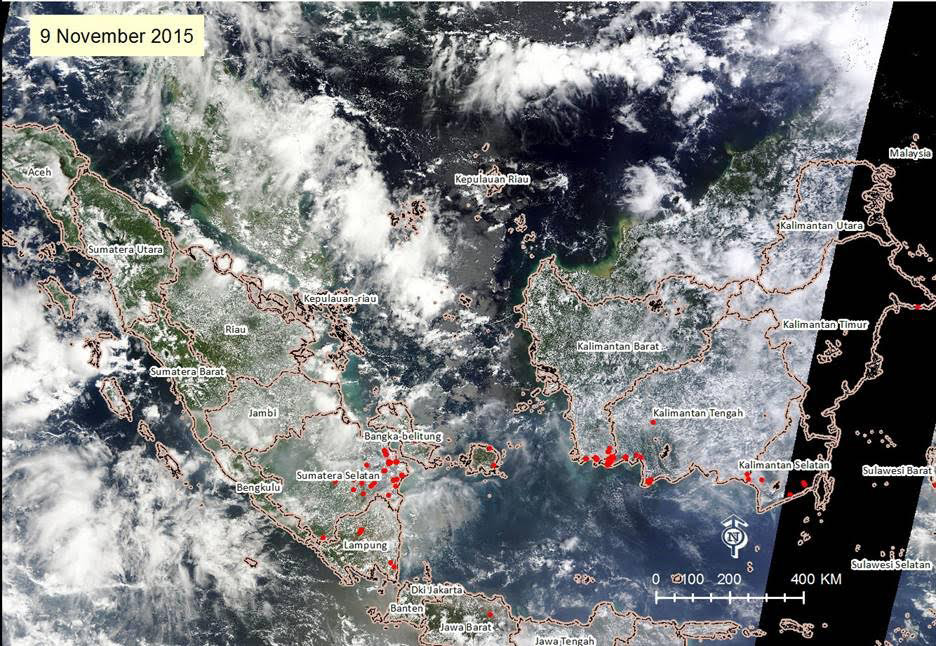
Haze and Hotspots Maps 9 November 2015
November 9th 2015
61 hotspots detected in South Sumatera while there was only one hotspot detected in East Kalimantan.
(confidence level of the hotspots displayed on the map is more than 60)
The CO2 pollution has been slightly decreasing for now. Today's estimate: 0.50 ppmv for Palembang, South Sumatera, while for Samarinda, East Kalimantan, it is approx. 0,18 ppmv.
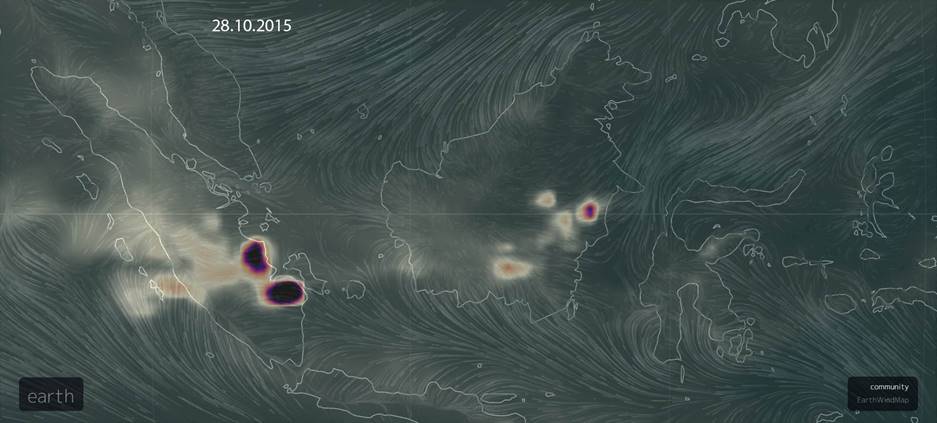
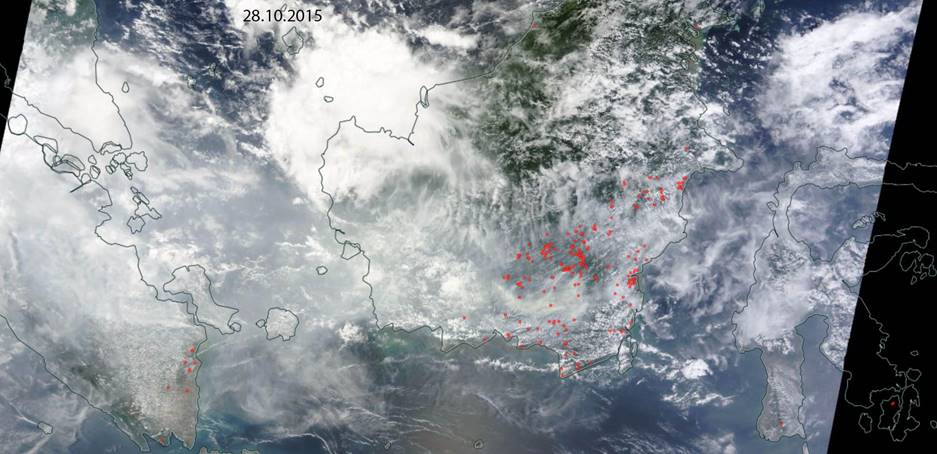
Haze and Hotspots Maps 28 Oct 2015
The last couple days, East Kalimantan experienced rain on most of the province. So today for Samarinda, the haze has been decreasing significantly even though not completely gone. However, today, there are some hotspots detected over East Kalimantan area, mainly located on East Kutai District as shown on the haze and hotspots map.
Source: https://earthdata.nasa.gov/labs/worldview/?p=geographic&l=MODIS_Terra_CorrectedReflectance_TrueColor,Coastlines,MODIS_Fires_All&t=2015-10-28&v=102.15493556719355,-5.9477321842422235,124.65493556719355,4.9858615657577765
From the wind and carbon monoxide concentration map from today, it shows that the hotspots on East Kalimantan has value of 1.84 ppmv (parts per million volume, unit for air pollutant) while, the fires on South Sumatera produces 9.35 ppmv.
Source: http://earth.nullschool.net/#current/chem/surface/level/overlay=cosc/orthographic=-247.76,0.09,2048